Anyone who has ever worked in a retail store will be familiar with the concept of cross-selling. A customer wants a can of paint? Try to sell them some paintbrushes. That new cellphone they’ve just decided to buy? They’ll probably need a case to protect it. Online retailers (and digital services of all sorts) have taken this idea and run with it, to great success. Sophisticated algorithms sort through data on a customer’s past transactions, and those of similar-looking customers, to identify and recommend other products a customer might be interested in.
A large amount of cross-selling, whether attempted in store by a sales assistant or online by an algorithm, relies on the concept of complementarity: that certain products are often bought and/or used together. Relationships between products might be obvious – paint and paintbrushes, for example – or they may be obscure and only revealed through the analysis of large datasets. In a 2021 paper that highlights complementarity’s relevance to association analysis, Puka and Jedrusik put forward “a new measure of complementarity in market basket data”, which sheds light on how product recommendations can be derived.
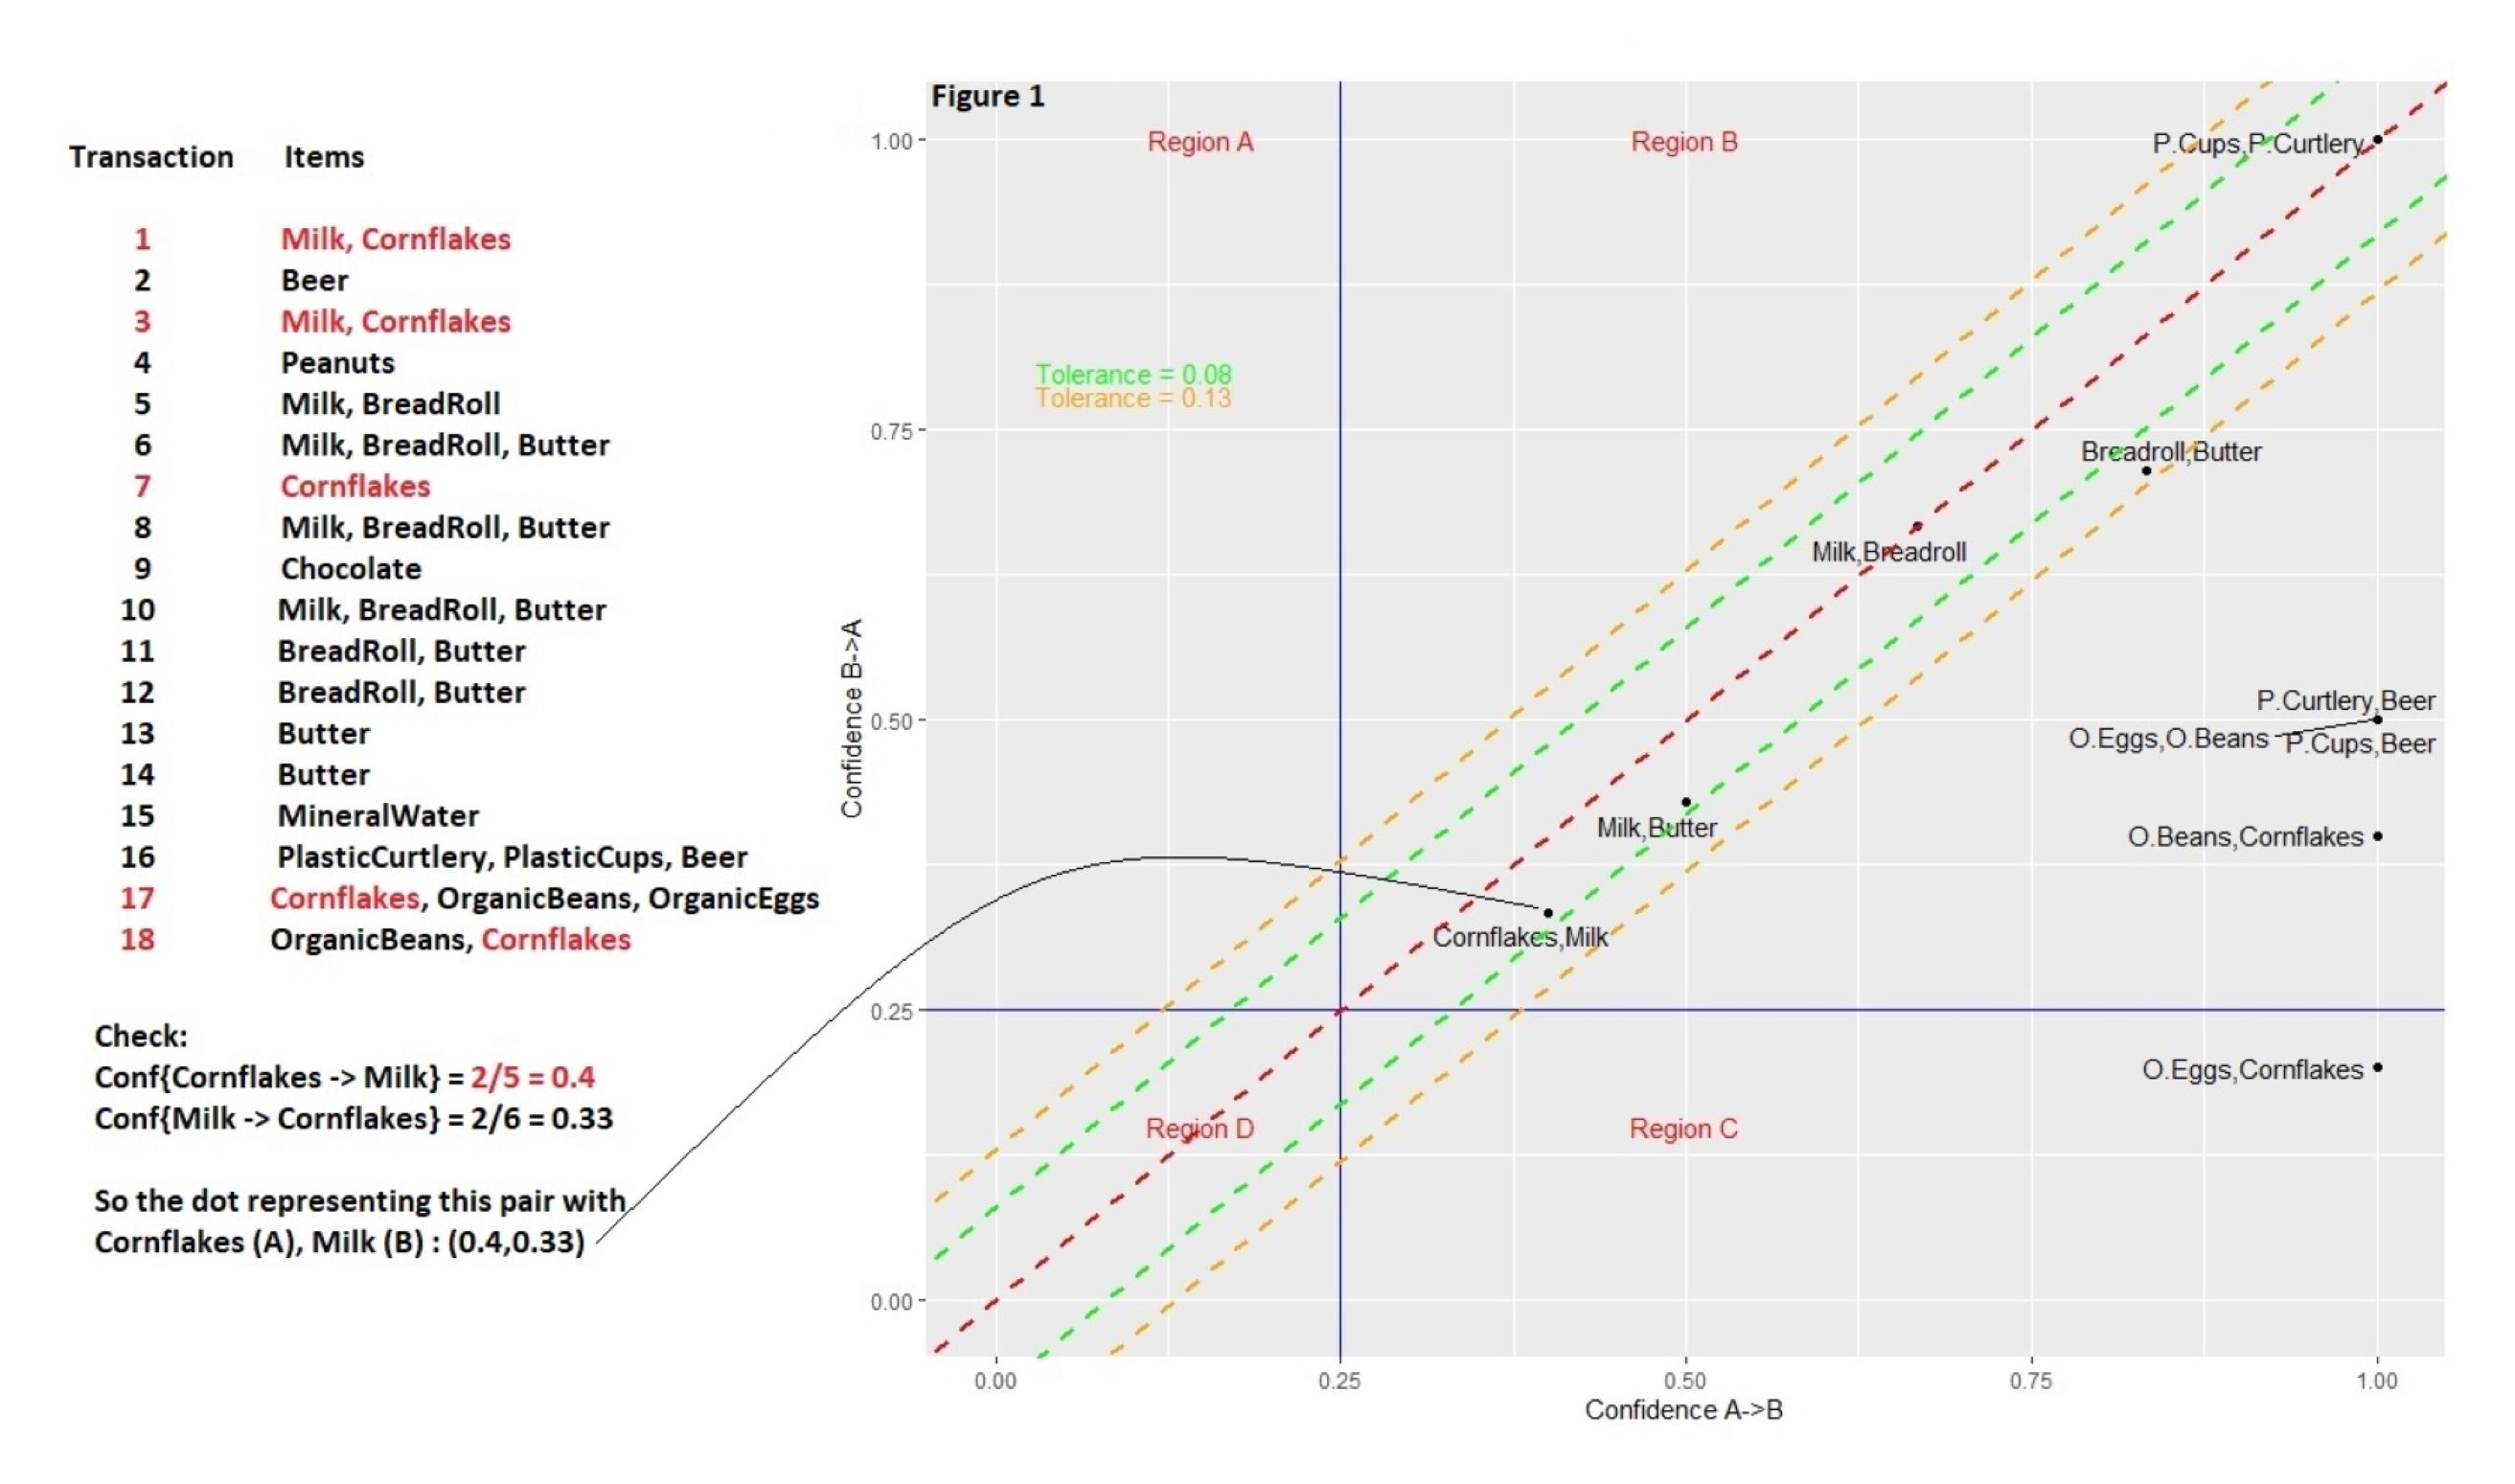
Inspired by complementarity-based ideas prevalent in microeconomics, Puka and Jedrusik begin by collecting some established ideas from traditional market basket analysis, the key one being “confidence”. In this case, we’re talking about the confidence that item A leads (in a way) to item B (which we can express in notation as conf({A} → {B})). Take a look at Table 1 (below), which presents a numbered list of 18 shopping trips, with details of what was purchased on each trip. Notice how two of the trips (1 and 3) resulted in sales of both milk (B) and cornflakes (A), while five trips (1, 3, 7, 17, and 18) had cornflakes. Under the assumption that someone already has cornflakes in their trolley, the probability that they will buy milk is 2/5 = 0.4. So, conf({cornflakes} → {milk}) = 0.4. The closer this number gets to one, the more automatic the cornflakes–milk connection becomes. This number can therefore be used to recommend an item that is related in some way to another already bought.
Table 1: A list (with each row representing a trip to a grocery store) that can be seen in one of two ways: (a) a record of what 18 different people bought, or (b) a history of one person’s purchases over 18 trips. The list is similar to the one examined by Puka and Jedrusik, except for the last three rows. These trips, under interpretation (b) may help us develop an understanding of a single shopper’s preferences.
Figure 1: Basket complementarity under varying tolerance. The horizontal axis reports the probability that someone will buy item B under the assumption that A is already in their shopping trolley (i.e., conf({A} → {B})). The vertical axis reports the opposite: the chance that someone will go for A given that B is already in the cart (i.e., conf({B} → {A})). For any pair of items, these two probabilities can be found and, when plotted in 2D, a pair of items generates a single point. The more similar the two probabilities are for each pair, the closer the point comes to the line of equality (the red dashed line that runs diagonally through the origin), and the more complementary the items become. It’s rare that a dot will land exactly on the line of equality, so the green and orange lines parallel to the red line mark how far off a dot is from this ideal setting, using different levels of tolerance. From this we may say, for example, that cornflakes and milk are more complementary to each other than bread rolls and butter, as the first pairing lies closer to the line of equality.
1 Asymmetry and tolerance
Milk and cornflakes are reasonably complementary, and we can see from Figure 1 above that, regardless of whether you start by picking up milk or cornflakes, the probabilities of a shopper buying the other item are broadly similar: conf({cornflakes} → {milk}) = 0.4, while conf({milk} → {cornflakes}) = 0.33. There is a small amount of asymmetry in the probabilities in this particular example, but asymmetry can be more extreme for other pairs of items. This leads to the idea of one- and two-sided complementarity. Two items sharing a smallish asymmetry – like milk and cornflakes – will be connected through two-sided complementarity, while large asymmetries indicate one-sided complementarity. Such imbalances will be quite common when, for instance, items of hugely different prices are involved. When someone buys a house, for example, they may want to buy a bookcase, but buying a bookcase doesn’t mean someone wants to buy a house: this would be an instance of one-sided complementarity.
Puka and Jedrusik capitalize on this observation. They define two items to be “basket complementary” if the two probabilities – the normal and its opposite – remain close and reasonably high. The items need to share a bond that is blind to the direction: seeing you bought one, no matter which, means you are (almost equally) likely to buy the other.
It is rare that the two probabilities should be exactly the same, of course, and the authors allow some deviation. Along the red diagonal line of perfect equality (Figure 1) we may lay tolerance bands marking degrees of product inseparability. This, if need be, may lead to the notion of being complementary at such-and-such a tolerance level – 0%, 1%, 5%, etc. – generating a score of sorts. In cases where a dot representing the two-way dependencies between two items falls within a narrow band – corresponding to a smaller tolerance – the more inseparable the items are, and the more sensible a cross-selling recommendation may become.
2 In conclusion
A large part of the world we inhabit, particularly the economy, is powered by recommendations: from strangers, friends and algorithms. That applies not only to the things we buy but also to the things we watch or read. (Perhaps you arrived at this article because of a tweet that Twitter thought you might like, or maybe it was suggested to you by Google News because of your past reading habits.) Whatever the intent of these recommendations, the key challenge is in knowing which two things are functionally or thematically intertwined. Which item or product is, by default, synonymous with which? Puka and Jedrusik deliver an answer: two items that are basket complementary to each other, preferably at a slim tolerance, are inextricably linked. One may be safely offered – perhaps always – whenever the other is already in the shopping basket.
The relative simplicity and interpretability of basket complementary may provide small-scale retailers, starved of analytical wherewithal, a sane and safe strategy for developing their product offer. It might also serve as a benchmark to keep other, more sophisticated recommendation algorithms in check. (In weather forecasting, for example, it is often seen that naive benchmarks – such as using today’s temperature to predict tomorrow’s – frequently outperform more advanced models.)
Basket complementarity could also be used to help individuals understand their own shopping habits and the links between the things they buy. I’ve built an interactive dashboard where you can enter your own receipt lists and filter associations based on various confidence thresholds. The underlying code is also available.
- About the author
- Moinak Bhaduri is assistant professor in the Department of Mathematical Sciences, Bentley University. He studies spatio-temporal Poisson processes and others like the self-exciting Hawkes or log-Gaussian Cox processes that are natural generalizations. His primary interest includes developing change-detection algorithms in systems modeled by these stochastic processes, especially through trend permutations.
- About DataScienceBites
- DataScienceBites is written by graduate students and early career researchers in data science (and related subjects) at universities throughout the world, as well as industry researchers. We publish digestible, engaging summaries of interesting new pre-print and peer-reviewed publications in the data science space, with the goal of making scientific papers more accessible. Find out how to become a contributor.
- Copyright and licence
- © 2023 Moinak Bhaduri
This work is licensed under a Creative Commons Attribution 4.0 (CC BY 4.0) International licence, except where otherwise noted.
- How to cite
- Bhaduri, Moinak. 2023. “Using ‘basket complementarity’ to make product recommendations.” Real World Data Science, March 2, 2023. URL

